

Rumours of potential mergers and acquisition (M&A) have huge consequences for those involved. Their impact on equity prices and sought after fees mean it comes as no surprise it is often found on the front page of financial media. M&A activity is a shortened term generally used to describe the consolidation of multiple companies to generate synergies not possible as individual entities.
Global M&A deal value peaked across 2021 with over $7 Trillion AUD worth of deals, 3 times larger than Australian GDP. (PwC, 2024 & World Bank, 2024). However, undoubtedly, global M&A has slowed since this peak, at just 50% of its peak as the market faces uncertain economic headwinds and rates as high as 5.3% (Aug 2023 FED Rate). So given M&As economic significance, can it be used as a predictor of macroeconomic variables?
Unsurprisingly, Australia’s M&A market is small compared to the global market, Australia’s $13 Billion deal values make up just under 1.8% of global M&A deals (Gilbert Tobin, 2023). Despite a reputation for robust financial markets and key natural resources, the Australian market has historically had relatively low M&A total deal values relative to its economy size. Australia’s M&A is lower than other first-world countries such as the US and Canada, each respectively having a 9% and 8% M&A (of GDP) compared to Australia’s 6% (PwC, 2023 & World Bank, 2024). Reasons for this difference could include geographical disadvantages and a resistance to international takeovers. Similarly to Australia’s economic strength more generally, Australian deals largely occur across materials and natural resources sectors. In 2023, 51.3% of M&A across Australia was in the materials space, including companies selling resources such as Iron Ore and Gold (S&P Global, 2023). Notably, in late 2023 a proposed takeover worth $20B AUD of Origin Energy by EIG and Canadian Asset Manager Brookfield fell over (AFR, 2023).
Mergers and acquisitions can also play an important role in shaping key businesses and industries across economies, providing an interesting link with macroeconomic conditions of a country. It is expected that M&A activity will rise with booms in GDP as increased private sector confidence and investment allow for major deals to pass. However, there are also interesting schools of thought that suggest during recessions M&A activity may serve as an automatic stabilizer with lower costs of capital as interest rates drop and low labor costs. This article aims to examine the relationship between Australian M&A and key macroeconomic variables overtime.
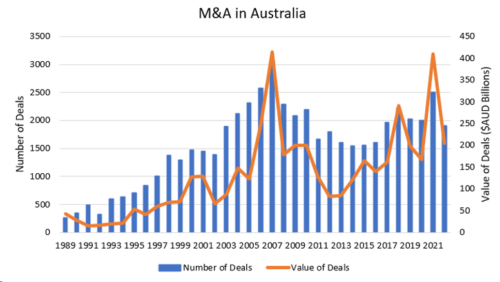
Graph 1: M&A in Australia overtime
Data Source: Reuters, Capital I
As per the graph 1, we can see that M&A activity in Australia was on a steady incline from early 1990s until around 2008, with over 400 AUD Billion in deals occurring in 2007. The growth of M&A in Australia during this period is likely to be caused by a few reasons, such as increased financial liberalisation and deregulation which started in the 1980s to stimulate economic growth. Some specific policies which encouraged this growth included the removal of strict interest rate controls on commercial and investment banks and the floating of the exchange rate in 1983. These policies increased our international competitiveness, further reducing the cost of capital. In 2008, the global financial crisis occurred, which led to decreases in economic activity and loss of consumer confidence. The effect of the recession is likely what caused the sharp down trend in economic activity in 2008 and then reduction in M&A activity until 2013. Following the recession, Australia faced lowering interest rates and recovering consumer confidence throughout the decade beginning in 2008, potentially causing the resurgence of M&A up until 2020. In order to empirically test the relationship between M&A in Australia and Macroeconomic factors, we can apply statistical regression methods.
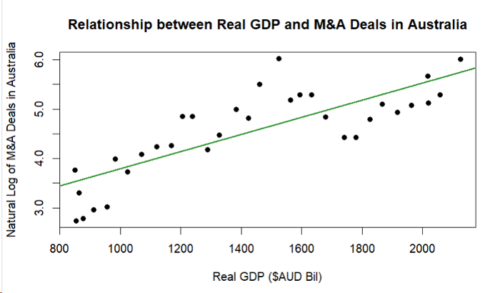
Given this history of M&A activity in Australia over the last 30 years, we can run a regression to test the relationship between Real GDP and the value of M&A deals in Australia. Real GDP has been chosen initially for analysis as it is the most general measure of economic activity in a nation.
Graph 2: Relationship between Real GDP and M&A Deals in Australia
Data Source: RBA, Reuters and Capital IQ
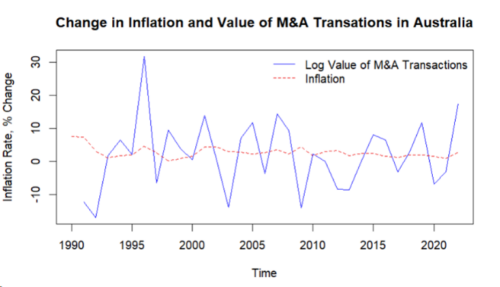
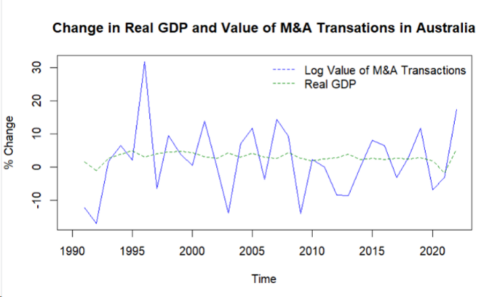
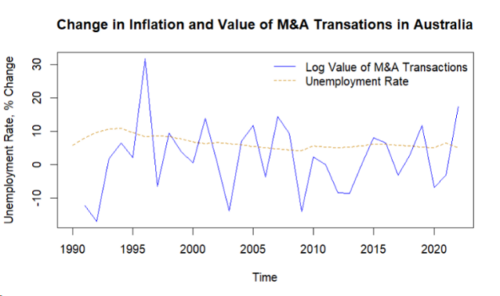
As we expect there is a clearly positive relationship between real GDP and M&A in Australia, this relationship is statistically significant, reporting very small p-value and an adjusted R^2 of 0.6365. While not necessarily implying causality, the high correlation between these two variables implies the likely result that the macroeconomic state does impact M&A in Australia. Conversely, M&A could impact macroeconomic state. Some economic reasons behind this relationship include depressed M&A activity as a result of economic uncertainty, tightened accessibility to debt and valuation uncertainty in a downturn. The combination of these factors results in difficulty in completing deals. While M&A activity tends to decline during recessions, there can be exceptions, especially if distressed assets become available at attractive prices. Companies with strong balance sheets may also see recessions as opportunities to acquire assets at a discount. This may result in the potential for M&A to act as an automatic stabilizer. Given this relationship can M&A in Australia be a leading indicator for economic conditions?Graphing key macroeconomic variables of real GDP, inflation and unemployment against the log value of M&A transactions in Australia we get the following illustrations.
Graph 3: Change in Inflation and Value of M&A Transactions in Australia
Data Source: RBA, Reuters and Capital IQ
Graph 4: Change in Real GDP and Value of M&A Transactions in Australia
Data Source: RBA, Reuters and Capital IQ
Graph 5: Change in Inflation and Value of M&A Transactions in Australia
 Data Source: RBA, Reuters and Capital IQ
While it is difficult to visually see the relationship of M&A values and key economic variables such as real GDP, inflation rate and unemployment rate, these variables can be analysed to test the hypothesis of any lagged relationship. Testing various vector autoregressive models related to these four variables results in no significant results, with each regression resulting in weak model fits. The only statistically significant relationship found in this analysis was the regression of the first lag in unemployment and first lag in deal size in determining unemployment rate, albeit being a weak one. The resulting VAR (1) regression is as follows:
∆UNRt=-0.07356+0.21095-0.54288∆LVDt-1
(0.08163) (0.11427) (0.20939)
∆LVDt=0.09725-0.10317∆UNRt-1-0.16997∆LVDt-1
(0.11762) (0.16466) (0.30171)
Where:
∆UNR=Differenced Unemployment Rate
∆LVD=Differenced Log Value of Deals in Australia
The negative coefficient on the first lag on the differenced log deal value in the first equation suggests that if there is an increase in M&A levels in the year before, there is subsequently a resulting decrease in unemployment in the following period. However, while this relationship remains statistically significant, standard error across the model remains relatively high. Combining a high standard error with a poor model fit and no significant relationship between any other macroeconomic variables such real GDP or inflation, it remains unlikely that M&A is reliable indicator of unemployment. Hence, we cannot find evidence to suggest any leading relationship between unemployment and M&A in Australia.
The conclusion is that M&A activity is correlated with macroeconomic health of Australia. It does not however act as a leading indicator for macroeconomic variables of real GDP or inflation. Despite high errors, a statistical leading relationship could be drawn from data between M&A and unemployment. Interestingly, Professor Christina Romer from the University of California also discussed the relationship between M&A and unemployment in a 2019 paper. Romer discussed the idea that M&A transaction volume on the unemployment gap works in opposition to the business cycle and acts as an economic stabilizer (Romer, 2019). In a similar sense to this article, there was statistical evidence for a leading relationship between these two variables, providing support to a potential leading relationship between M&A and unemployment where increased M&A could generally result in reduced unemployment.
References
The CAINZ Digest is published by CAINZ, a student society affiliated with the Faculty of Business at the University of Melbourne. Opinions published are not necessarily those of the publishers, printers or editors. CAINZ and the University of Melbourne do not accept any responsibility for the accuracy of information contained in the publication.