
In the intricate world of finance, one of the most powerful tools for market analysis is the yield curve. This seemingly innocuous graph is, in fact, a mirror to the future reflecting the complex interplay of interest rates and time, serving as a critical guidepost for investors, economists, and policymakers alike.
What is the Yield Curve?
The yield curve is a visual representation of interest rates on government bonds of various maturities, typically ranging from short-term to long-term bonds. It illustrates the yield or interest rate investors demand in exchange for locking in their capital for a specific period. The curve typically takes one of three shapes:
The yield curve’s true power lies in its predictive abilities. It provides insight into the market sentiment, inflation expectations, and economic health. It aids policymakers in their decisions on interest rates and helps investors make strategic choices, particularly in allocating assets and assessing risk.
Use Case in Market Analysis
Analysts scrutinize the yield curve’s shape, steepness, and shifts to gauge market expectations. It serves as a vital tool for predicting recessions, guiding investment strategies, and providing early warnings for potential market disruptions. For economists and investors alike, the yield curve is the compass guiding their financial journey, helping them navigate the uncertain waters of the global economy.

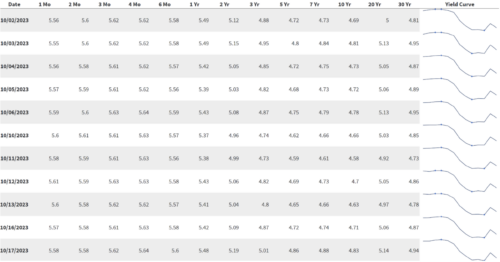
Figure 1: US Yield Curves Over Time
Source
Looking abroad to what is perhaps the most widely examined curve, as of October 18, 2023, the US yield curve is inverted. This is a rare phenomenon that has historically preceded recessions.
There are a few possible reasons for the inverted yield curve. One possibility is that investors are expecting the Federal Reserve to continue raising interest rates in the near term, while expecting in the long run that rates will be lower. This would make short-term bonds more attractive, as they would offer higher yields. Another possibility is that investors are worried about a recession and are switching to buying long-term bonds as a safe haven. This would drive down the yields on long-term bonds.
Regardless of the reason, the inverted yield curve is a warning sign that the economy is at risk of a recession. However, it is important to note that the yield curve is not a perfect predictor of recessions. There have been times in the past when the yield curve has inverted and a recession has not followed. It is important to note that the yield curve isn’t static. It can fluctuate on a daily basis in response to economic data and other factors, and is currently on the path to becoming uninverted. However, the fact that the US yield curve has been inverted for several weeks in a row is a significant development.
Investors should monitor the yield curve closely in the coming weeks and months. If the inversion persists, it could be a sign that a recession is on the horizon.
Hindsight is Twenty-Twenty (Three)
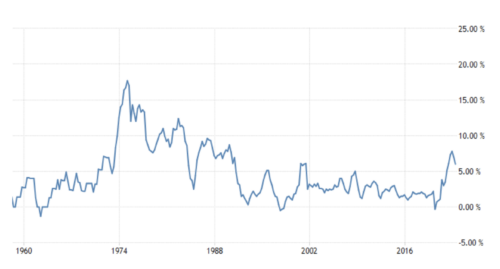
A look back in time at when yield curves have successfuly predicted recession could offer great insight into today’s situation. Current inverted yield curves and economic outlooks are somewhat reminiscent of the 1970s and early 1980s when the world was facing high inflation and elevated oil prices, partly thanks to geopolitical tensions. Preceding the high inflation of the 1970s and 1980s was the historically unprecedented prolonged sub-5% interest rates of the 1960s, not dissimilar to today’s situation of relatively high inflation following a period of ‘free money’ borrowing.

Figure 2: Australian Inflation Over Time
Source
Geopolitical Upheaval: A Catalyst for Tough Times
Once again similar to the current global outlook, it was geopolitical upheaval (albeit different to today) that spurred on economic challenges. The nascent OPEC’s imposition of an oil embargo on nations that supported Israel in the 1973 Yom Kippur War, such as the United States and United Kingdom, led to the expropriation of oil production facilities in the Middle East. With an estimated 53% of global oil being produced by OPEC nations at the time, combined with slowing US domestic production, the price of oil (in today’s dollars) rose from $14/barrel to $80/barrel (USD) in the span of 3 years. Then, a mere 6 years later, the 1979 Iranian Revolution caused the global oil production to fall by 4.8 million barrels per day, equivalent to approximately 7% of global oil production. Yet, it was the subsequent speculation and panic that defined the near tripling of oil prices, characterised by the fear of tension in the Middle East combined with the self-fulfilling nature of rising oil prices due to national stockpiling.
Equilibrium but at what Cost?
The eventual taming of inflation, spearheaded by Paul Volcker of the US Federal Reserve, spiraled the United States into a recession, which was similarly observed in Australia. Australia experienced two recessions through the 1980s, a period often regarded as the longest and hardest-hitting economic downturn in our nation’s recent history.
Future Outlook and Real World Implications:
While the current inverted US yield curve suggests short-term rates surpassing long-term rates, as mentioned yields are by no means static, and key indicators provide some intriguing insights that suggest long term yields may soon return to be higher.
Firstly, expected inflation seems to be structurally higher in the medium-term, given the sticky inflation for services that has been largely unaffected by rate rises (measured by the SuperCore PCE in the US). This higher expected inflation results in investors expecting a higher nominal rate of return, to ensure the returns from bonds remain above the rate of inflation.
Another key driver of long-term yields is the “term premium” investors receive for entering into long-term debt arrangements with federal governments. Given rising global debt levels that are now being refinanced at higher rates, default risk, while slim, is a far more legitimate concern for investors. Additionally, as Western central banks embark on quantitative tightening, this could further influence term premiums.
While the impact of this may seem abstract, there are clear tangible consequences to higher long-term yields in the real world:
Final Thoughts
In a world rife with economic intricacies and geopolitical tensions, understanding the indicators that signal impending market shifts becomes crucial. The yield curve, with its predictive prowess has proven time and time again its value as an economic barometer. In tandem, looking ahead at the expected behaviour of long-term yields provides a nuanced view of where the economy might be heading, making these tools indespensible for forward-thinking investors and policymakers around the world.
The CAINZ Digest is published by CAINZ, a student society affiliated with the Faculty of Business at the University of Melbourne. Opinions published are not necessarily those of the publishers, printers or editors. CAINZ and the University of Melbourne do not accept any responsibility for the accuracy of information contained in the publication.